Radio Waves

This week saw the highest equinoctial spring tides of the year around the UK. Professor Philip Woodworth of the National Oceanography Centre appeared on Radio Lancashire and Radio Merseyside to explain what causes tides and also talk a little bit about why predicting future tides and calculating historical sea levels is important. For instance, tides played an large role in Julius Caesar’s decision to attempt a landing in Kent in 54BC and also the timing of the battle of Hastings.

A very large equinoctial spring tide will occur in September 2015, which should make for a powerful tidal bore in the Mersey Estuary.

Tidal bore on the River Mersey. Photo by Colin Bell.

Tidal bore on the River Mersey. Photo by Colin Bell.

Tidal bore on the River Mersey. Photo by Colin Bell.

Tidal bore on the River Mersey. Photo by Colin Bell.

You can hear Prof Woodworth using the listen again feature at the BBC Radio Lancashire website (02:41:00) and the BBC Radio Merseyside page (02:50:39).

Shoot first, ask questions later

Recently we began filming our end of project case study video. We decided to start by interviewing the students who worked on the Open Educational Resources about their experiences. We also spoke to their supervisor, Senior Lecturer Dr Harry Leach from the University of Liverpool. We asked him to tell us why he thought saving historic sea level data was important.

Interview room

We put our newly developed filming skills to use – we used two cameras, a video camera and a digital single-lens reflex (DSLR), to capture the interviews from two different angles.

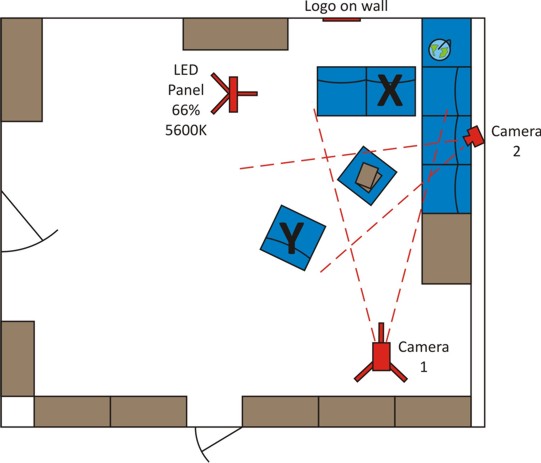
Our colleagues at the National Oceanography Centre had filmed in a room in our building recently and created a diagram for others to use, showing where to put the camera, lights, interviewer and interviewee in order to make the best use of the natural light. This made it quick and easy for us to set up. We had to deviate from their instructions slightly as they’d designed a setup for filming one person, while one of our interviews was with three people.

Layout of equipment for filming the interviews

We’d planned our interview questions beforehand and managed to film about 15 minutes of footage, which should give us plenty to edit down into a five minute video. The only problem we had was some very noisy seagulls outside, but I think they’ll lend a suitably maritime atmosphere to the piece!

Tide Films II: This time it’s on Youtube

In September, we blogged about unearthing some historical films in our archive. Since then, we’ve been able to digitise the footage and investigate further.

One of the films is now on YouTube. “The Progression Of The Tides” is a film made by the Liverpool Tidal Institute some time in the 1960s. An educational film, it explains how the sea level around the UK changes over the course of the semi-diurnal tidal cycle. Below are screenshots from the video.

Progression Of Tides screenshot

Progression Of Tides screenshotWatch the complete film on YouTube.

Seminar on the Liverpool Tidal Institute

Today I attended a seminar given by Dr Anna Carlsson-Hyslop from Lancaster University. The seminar was based on research she carried out for a PhD at Manchester University on the history of Science, specifically “Storm surge science at the Liverpool Tidal Institute 1919 – 1959: funding and practice” (abstract).
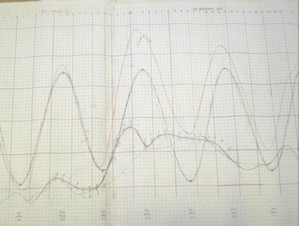
Graph showing storm surge of the 1953 Flood

Graph showing storm surge of the 1953 Flood

The talk was particularly interesting as it discussed the development of sea level science in Liverpool from a social historian’s perspective. In particular, it placed emphasis on the drivers for change in scientific studies, e.g. changes in funding, changes in policy and political motivations.

The presentation also concentrated on the directors of the Tidal Institute and, alongside looking at their contribution to the scientific field, also examined their characters and the change in way they self-identified over time from mathematicians to oceanographers.

What I wanted to know was: what motivated somebody to want to study the history of the Tidal Institute? Perhaps this could help us identify potential new users of our data. Dr Carlsson-Hyslop said she had been interested in the study of extreme weather events, which led her to study the flooding of central London in 1928, and from there on to the study of the history of the Tidal Institute.

The talk combined parliamentary papers, newspaper extracts and materials from the archive in the World Museum, Liverpool It would be nice to think that perhaps someone could use our digitised data in a similar project in the future.

Sea Level Data at the Olympics

Sailing boats

Sailing relies on accurate tidal data recording

Britain’s triple Olympic sailing gold medallist Ben Ainslie has been quoted as saying:

“When I started sailing as a youngster, trying to qualify for the Olympics at Atlanta in 1996, there was no funding in place at all. When I received the Olympic funding in 1997-98, it effectively gave me an extra £20,000 a year as a top performer. I have absolutely no doubt in my mind that sailing and all the Olympic sports would be a lot poorer without that level of investment. Looking at the sport we had then compared to the sport we have now it’s almost unrecognisable: all the physio, support on the water, meteorology and tidal analysis is there because of the cash we get now.”

As part of their preparation for major events, Olympic sailing teams gather detailed information about the local sea conditions (currents and tides), to give them every possible advantage on the day. The custom tidal analyses the teams use require quality-controlled sea level data.

It would be nice to think that perhaps the NTSLF tide gauge at Weymouth may have helped provide data for the tidal analyses that allowed our athletes to sail to victory.

During the Olympics, the Met Office are generating daily forecasts of tidal information for the race area.

Predicting the Future (using historic sea level data)

Our tide gauge data has been used to validate models that predict future sea level rise and storminess, such as those used by Defra. Increasing the amount of data available for analyses and extending records back chronologically helps scientists to improve their predictions.

The BBC Radio 4 programme Material World, broadcast on 26 July 2012, contained a section discussing the possibility of tsunamis, specifically those caused by underwater landslides, affecting the UK. Predicting the degree to which a tsunami could inundate the UK coastline in the future relies on predictions of future sea levels.

Seven Dials Sundial Pillar

Seven Dials Sundial Pillar, photograph by Julian Andrews.

Data predicting future changes in sea level can also be of interest outside the science community. Earlier this year, the artist Michael Pinsky transformed three monuments in central London, using a ring of blue light to illustrate where sea level could be 1000 years into the future.

The Chart’s in the Post

We have spent the last week preparing charts for delivery to the firm carrying out the digitising work.

The initial project plan states that the charts were to be digitised in four batches, to be delivered at the end of May 2012, August 2012, November 2012 and February 2013. After the delivery of the first batch of data, the digitising firm asked us if it would be possible to send all of the remaining charts in one go, to simplify their work planning.

Charts in their boxes, ready to be delivered

Charts in their boxes, ready to be delivered

The charts we’re sending are from 15 sites, located all around the UK. Preparing them for transport isn’t just a case of sticking them in a box. We’ve had to check that what we have listed in our archive database matches the records we hold, before preparing a loan record (another database entry that tells us which records are held where). As well as setting up a paper trail, we have to make sure that the charts themselves are in a suitable condition to travel. The oldest of the charts we’re sending date back to 1943 and some are in a fragile condition.

Next week a member of staff from NOC Liverpool will drive them to the digitising firm in one of NOC’s vehicles, to ensure safe delivery.

NERC Archives Group

Last Tuesday, NERC’s archives and records managers groups met at NERC headquarters in Swindon. The archives group consists of representatives from the British Antarctic Survey, the British Geological Survey, the British Oceanographic Data Centre, the Centre for Ecology and Hydrology and the National Oceanography Centre.

Two of the topics we discussed are relevant to the JISC content programmes. One concerned how we deal with copyright. For instance, if a volunteer comes in to help us catalogue our records, they create metadata in doing so. Does the copyright of the metadata they have created lie with them, or with our organisation? Can we pass that metadata on to third parties or make it publicly accessible?

NERC head office at Polaris House in Swindon

NERC head office at Polaris House in Swindon

The other relevant issue discussed was how we measure performance. Each group has to provide performance measures at the end of the year. These include keeping a database of requests, along with the standard recording of website statistics. These help us monitor the impact of our groups and help us to provide a more useful service in the future. Through the JISC content programme, BODC hope to find new and improved ways of monitoring our impact, and these meetings give us the opportunity to pass these ideas on to the other archives members.

Though this blog is mainly about the JISC Rescue of Historical Sea Level Data project, and other things involving BODC sea level data, we would like to draw your attention to the services offered by the other NERC archives groups.